Automated analysis of drosophila melanogaster wing imaginal disc intensity measurements
This Project is a collaboration with Shinya Matsuda. The aim of this project is to facilitate the analysis and comparison of intensity measurements of wing discs. Two scripts were generated for this project.
Automated alignment of wing imaginal disc intensity measurements
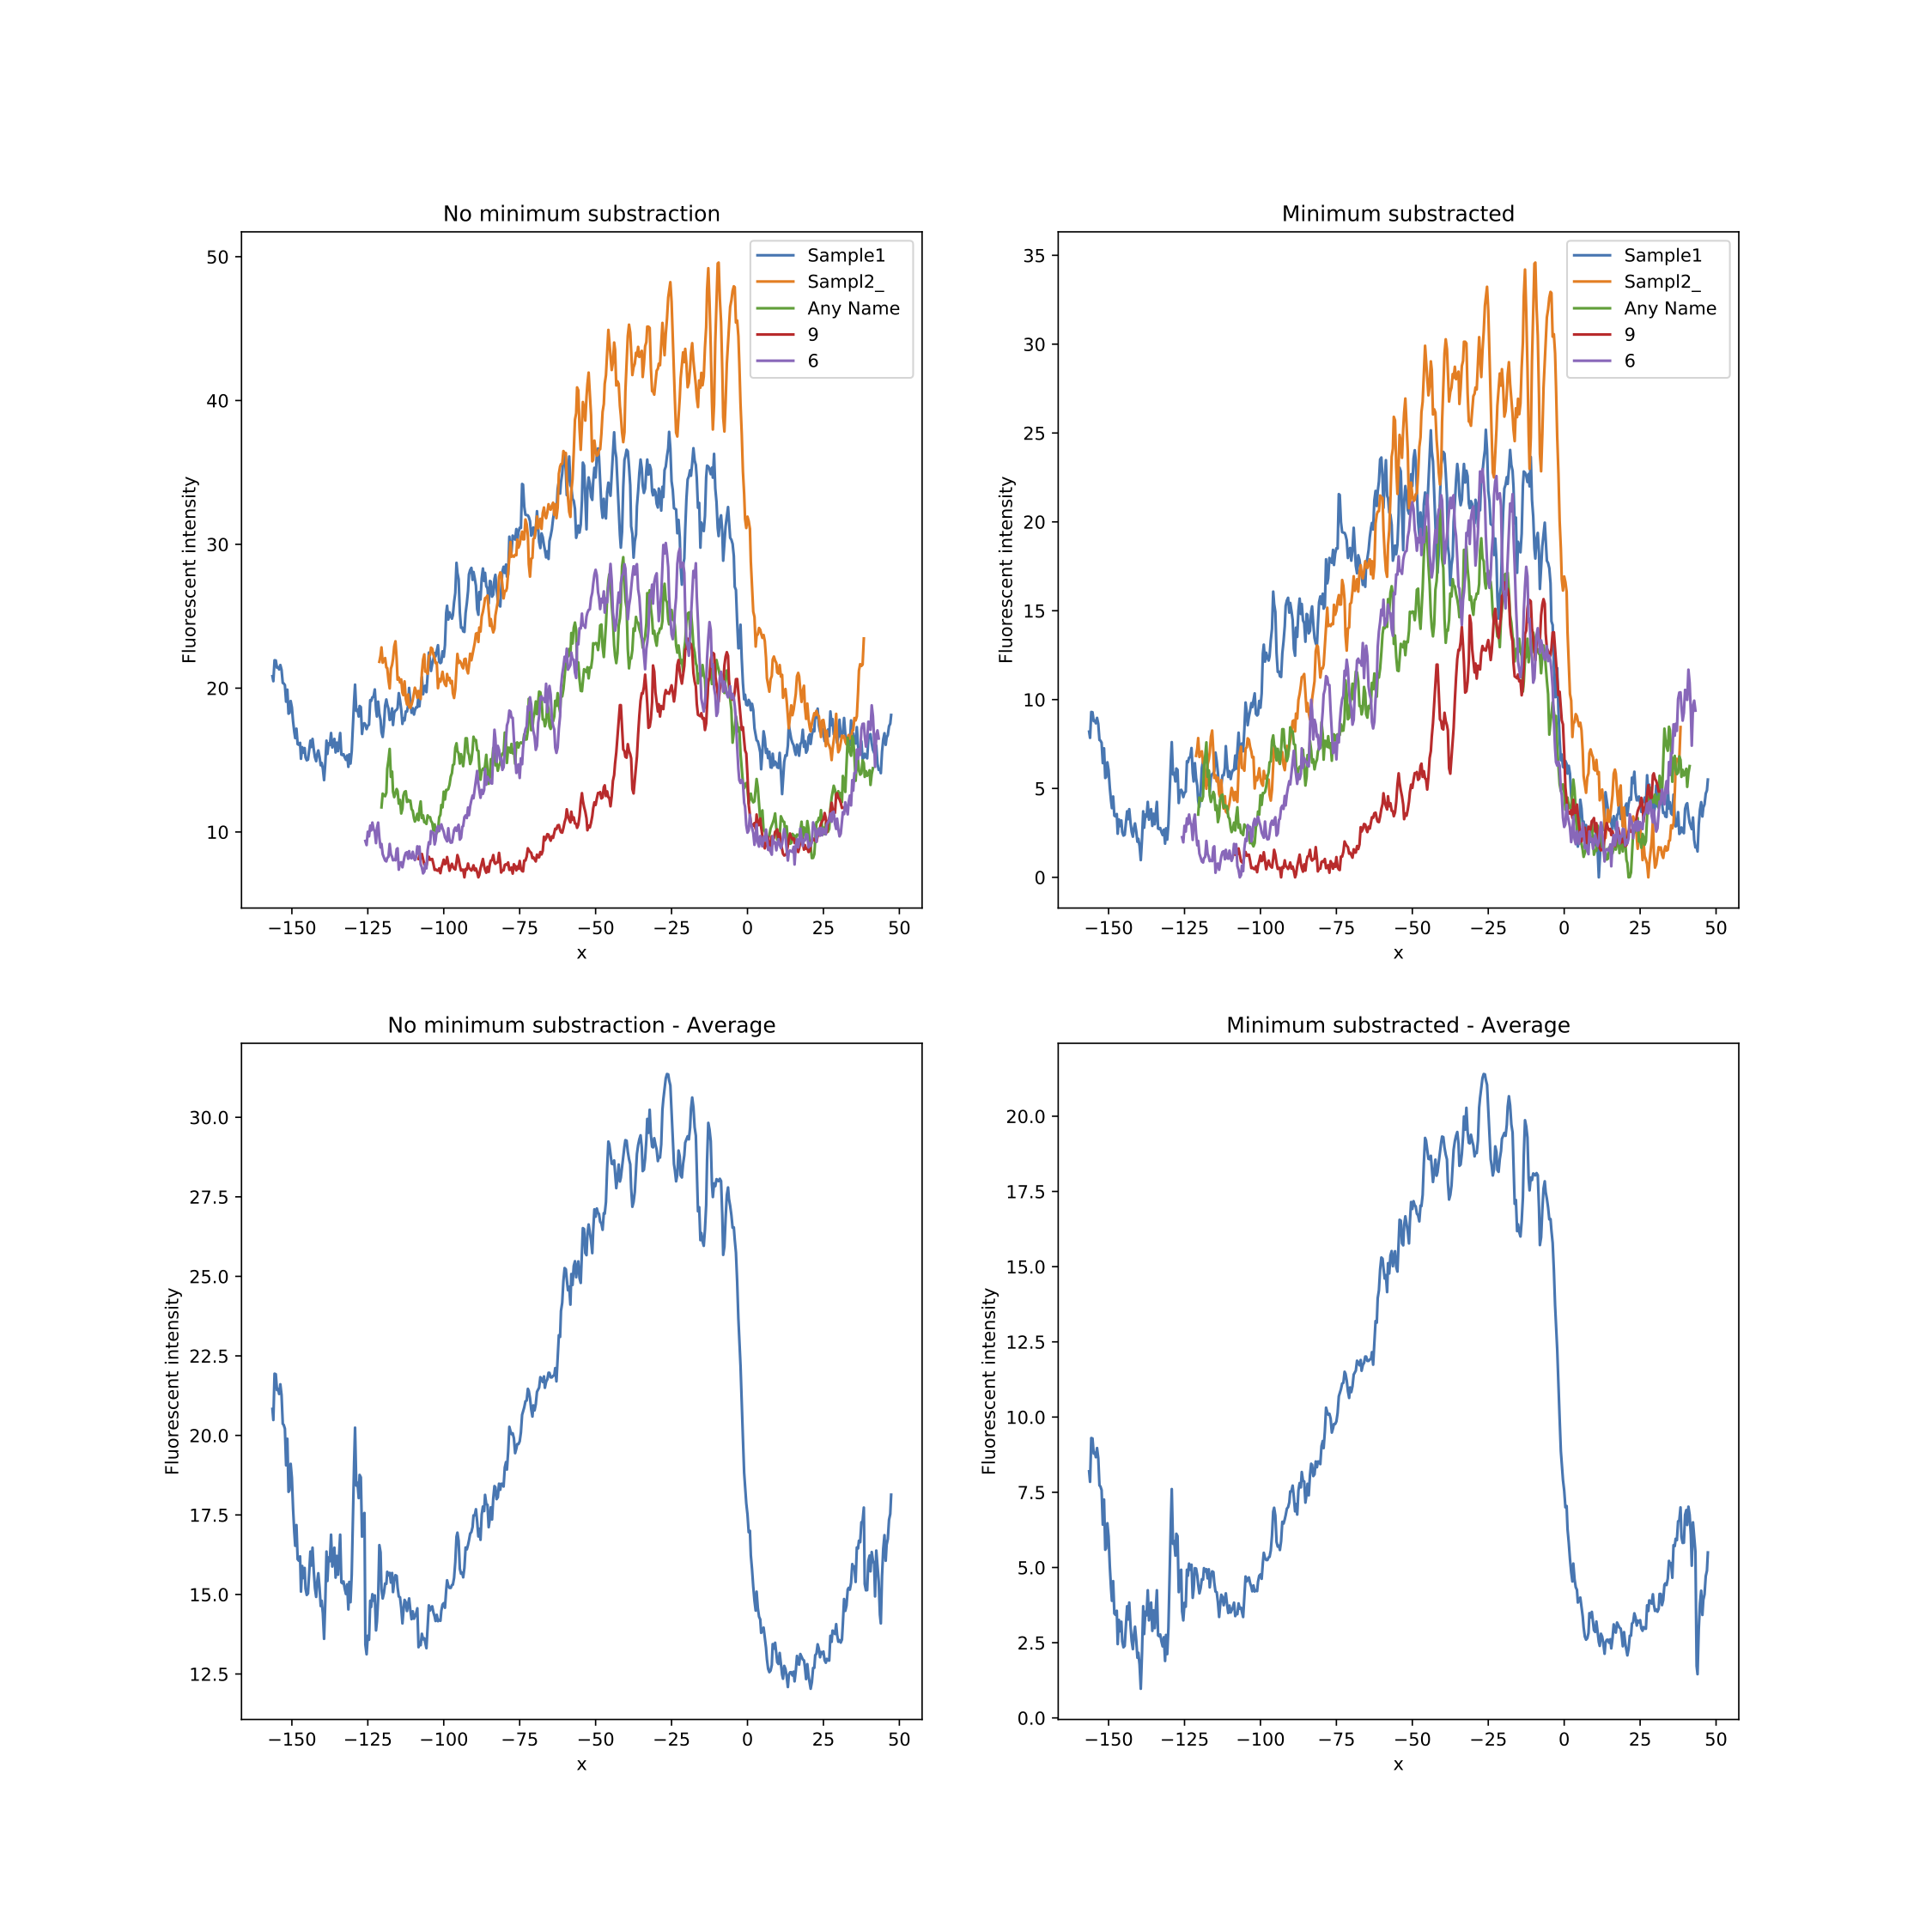
The script wing_disc-alignment.py takes one or multiple excel file(s) like wingdiscs.xlsx as input. One excel files corresponds to one experimental condition (e.g. WT). Each sheet of this Excel file corresponds to one analysed wing imaginal disc, containing the x-value, the intensity value and the x-correction value. The x-correction value will be used to normalize the x-values. Once the data is preprocessed it will be merged and aligned in two databases:
- filename_min_sub.xlsx the intensity of each wing imaginal disc is normalized. The intensity values are subsrtracted with the lowest intensity value of the set/wing imaginal disc.
- filename_no_min_sub.xlsx no normalization is performed
This normalization does not change the relative Intensity differences, therefore the Intensity profile is not changed. For both datasets/databases the average, the standard deviation and the number of values in each row are calculated. Further the database is exported as excel file and a comparison plot is generated.
NEW FEATURE: You can pick as many experiments as you want at once, it will process them one after the other !!!
In order to facilitate the analysis for the User, standalone executables for Windows and macOS were generated. This allows any (macOS or windows) user to operate the programs without prior installation of Python.
Example excel files for this script:
Comparison Plot of wing_disc-alignment.py:

Automated merge and comparison of multiple datasets
The results generated with wing_disc-alignment.py can further be analysed with wingdisc_comparision.py. This script will normalize the data according to the operator’s choices and combine the different experimental conditions in one excel file. It allows to select a control (e.g. wild type expression pattern) with (unlimited) mutant conditions. Based on Shinya Matsuda’s needs, the following options were integrated: The operator can choose between three options to normalize the datasets:
- (option: “y”) substract the minimum of the control from the Intensity values of each condition,
- (option “n”) the minimum value of each condition is used for normalization
- (option “no_min”) no normalization is performed.
The data is processed depending on the previous choice and the results are combined in an excel file. Additionally, a Summary Plot is generated automatically for quick control and analysis.
In order to facilitate the analysis for the User, standalone executables for Windows and macOS were generated. This allows any (macOS or windows) user to operate the programs without prior installation of Python.
How to make the scripts an app:
Install anaconda python 3.XX open terminal/Command line and create the virtual environment:
conda create --name appmaker matplotlib pandas tk xlrd openpyxl pyinstaller
cd to the the directory of the python script and activate the virtual environment:
conda activate appmaker
pyinstaller --onefile scriptname.py
conda deactivate
The executable will be in the “dist” folder. If you would like to remove the virtual environment:
conda remove --name appmaker --all
conda info --envs
If you would like me to automate your (tedious ;) analysis or you have questions, don’t hesitate to contact me!!