4c-Visual
This Documentation is about 4c-Visual, a tool developed by Dr. Etienne Schmelzer. It allows to clean and cross-reference data from 4 different Databases (SalesForce, IQVIA, Redbook & Lauer).
4c-Visual is (a small) visualization element of the 4c-Initiative. 4c stands for Comprehensive, Clean and Central Comparator Business Intelligence Tool.
The 4c-Initiative aims to automate, standardize and centralize the Comparator Workflow.
Introduction - The Need to simplify our access to Data
Data driven decision making (DDDM) has become one of the fundamental concepts of modern businesses. A modern business leverages all its available data in order to take informed decisions. But leveraging all available data is in general difficult and cumbersome as the data sources are often decentralized, heterogeneous and chaotic. In order to facilitate the access to four different data sources (SalesForce, IQVIA, Redbook & Lauer) 4c-Visual has been created. 4c-Visual is a combination of a Python script (4c-update)/an executable and the Business Intelligence Tool Power BI (by Microsoft).
Setup - Environment
- Install the Environment (mainly Conda + simple_salesforce and some additional packages)
Use the environment.yml or requirements.txt file.conda env create -f environment.yml - Activate the Environment:
conda activate clean
Credentials & Settings: authpass.json
The authpass.json file contains the necessary credentials and stores some
important settings, which are explained below.
An example is given in authpass_example.json.
- commands
Set to “True” if you would like to clean and cross-reference the rawdataset.- droogleupdate: Pulls the Data from SalesForce, cleans and cross-references it
- lauerupdate: Cleans and cross-references the data from Lauer
- redbookupdate: Cleans and cross-references the data from Redbook
- iqviaupdate: Cleans and cross-references the data from iqvia
- “SalesForce”
Contains the Credentials for pulling the Data from Salesforce- “global_drug_report” contains the report id of the SalesForce Report
-
“SF-Sandbox” - optional
Optional!! Only for development purpose - contains Credentials for a Sandbox. -
“filepaths”
Contains the file paths for the raw data and processed data.- parent contains the file path (to your working directory) I recommend to use a working directory on SharePoint. It will allow you to synchronize your future Power Bi reports.
- rawdata: Contains your Rawdata
- destpath: Will contain your processed and cross-referenced files
- “iqvia_settings”
- iqvia_fix_columns: Number of fixed columns until human readable Standard Units per Quarter If you extend the IQVIA Report make sure to extend column count in Power Bi Report.
- iqvia_quarters: If a new Quarter is available please adjust.
-
“corrections”
Contains the corrections for Market Presentation. You can extend this dictionary. -
“corrections_iqvia”
Contains the corrections for the Iqvia Database - correcting some quantities -
“SQLServer” - optional
Not needed for 4c-Visual! Only for development purpose. Contains the Settings for MSSQL Server - “DjangoSQLServerSettings” - optional
Not needed for 4c-Visual! Only for development purpose. Contains the Database Settings for the Django Settings file.
Core elements of 4c-Visual
4c-Visual is a combination of 4c-update and the Power Bi Report 4c.pbix.
The python script 4c-update extracts, cleans and cross-references the data and can also be
turned into a scheduled executable.
In contrast the Power Bi Report 4c.pbix in combination with the Microsoft Premium Server
acts as a platform to visualize and distribute the data to the stakeholders/consumers.
4c-update
The Python script 4c-update is the core piece of this project. It extracts, cleans,
cross-references and saves the data as .csv file for the 4c.pbix Report to be picked up.
Each data source is processed in four steps:
Extraction
-
Extracting the data from the source
Except for SalesForce all Data is available as .csv files, which are updated only once per Quarter.
Therefore authpass.json contains the Setting “commands” which allows to choose independently which data source will be processed and updated. -
formatting it into a pandas Dataframe
Notes for SalesForce
Previous business practice used a SalesForce Report in order to extract the Data from SalesForce.
For simplicity a similar Report was build and used to extract the Data. 4c-update.py contains a GET request
which extracts a “csv”-style content, which is loaded into a pandas DataFrame.
If you would like to use a SOQL Query to retrieve your data check out my SF_connector.py. SF_connector.py
is part of the private 4c-Portal Project,…
Clean up
Not all available data is important and necessary for our business, therefore data is filtered and reduced to the essential informations before loading & processing. Additionally Human data entries can be inconsistent and errorprone. In order to reduce errors and redundancy the available is corrected, normalized and cleaned.
- deleting unnecessary rows/columns
- correcting entries
Allows to clean and standardize the entries in the datasets.
- The dictionary “corrections” in authpass.json contains the corrections for the Market Presentations for the SalesForce Data. This dictionary can be extended.
- The dictionary “corrections_iqvia” in authpass.json contains the corrections for the Quantities in the IQVIA dataset. This dictionary can be extended.
Cross-referencing
- loading the Reference File [MasterDrugList.xlx]
The current Business workflow dictates that new projects/opportunities are entered manually by a
Project Manager. Unfortunately, manual freetext entries are often source of inconsistent data entries.
Often not only a drugname is entered but also combined with package sizes, commas or further information, thereby distorting
the real proportions and quantities. In order to minimize misspresentations and normalize the data the Drugname & API entries are
cross-referenced with a MasterDrugList.xlsx containing the majority of traded Drugs and APIs of the business. The Entries
of this Excel file are used as a template to filter the manually entered Drugnames & APIs with regular expressions.
If the cross-referencing function finds a matching entry it assigns the correct entry in a new Reference column named “Drug” or “API”.
If no match is found in the MasterDrugList.xlsx the complete string of the dataset, together with a (not MLD) is assigned in the new Reference column.
The Reference columns (Drugname & API) are further appended to either a new or an already existing Reference file (depending on “newreference” setting in authpass.json).
Spoiler: The Reference columns will later allow the stakeholders/consumers to search all datasets with only one search.
- loading the Reference File MasterDrugList.xlsx
- cross-referencing
- if match is found: the correct Drugname is assigned
- if no match: the original value is assigned together with (not_MDL)
- Reference file is generated or appended
- if “newreference” = True in authpass.json a new Reference file is generated
- if “newreference” = False in authpass.json the existing Reference file is appended
Saving
All processed datasets are saved as .csv file in the destination folder defined in authpass.json.
Hint:
If available use SharePoint or Onedrive as destination folder. This allows PowerBi
to stay in sync with your (changing) datasets.
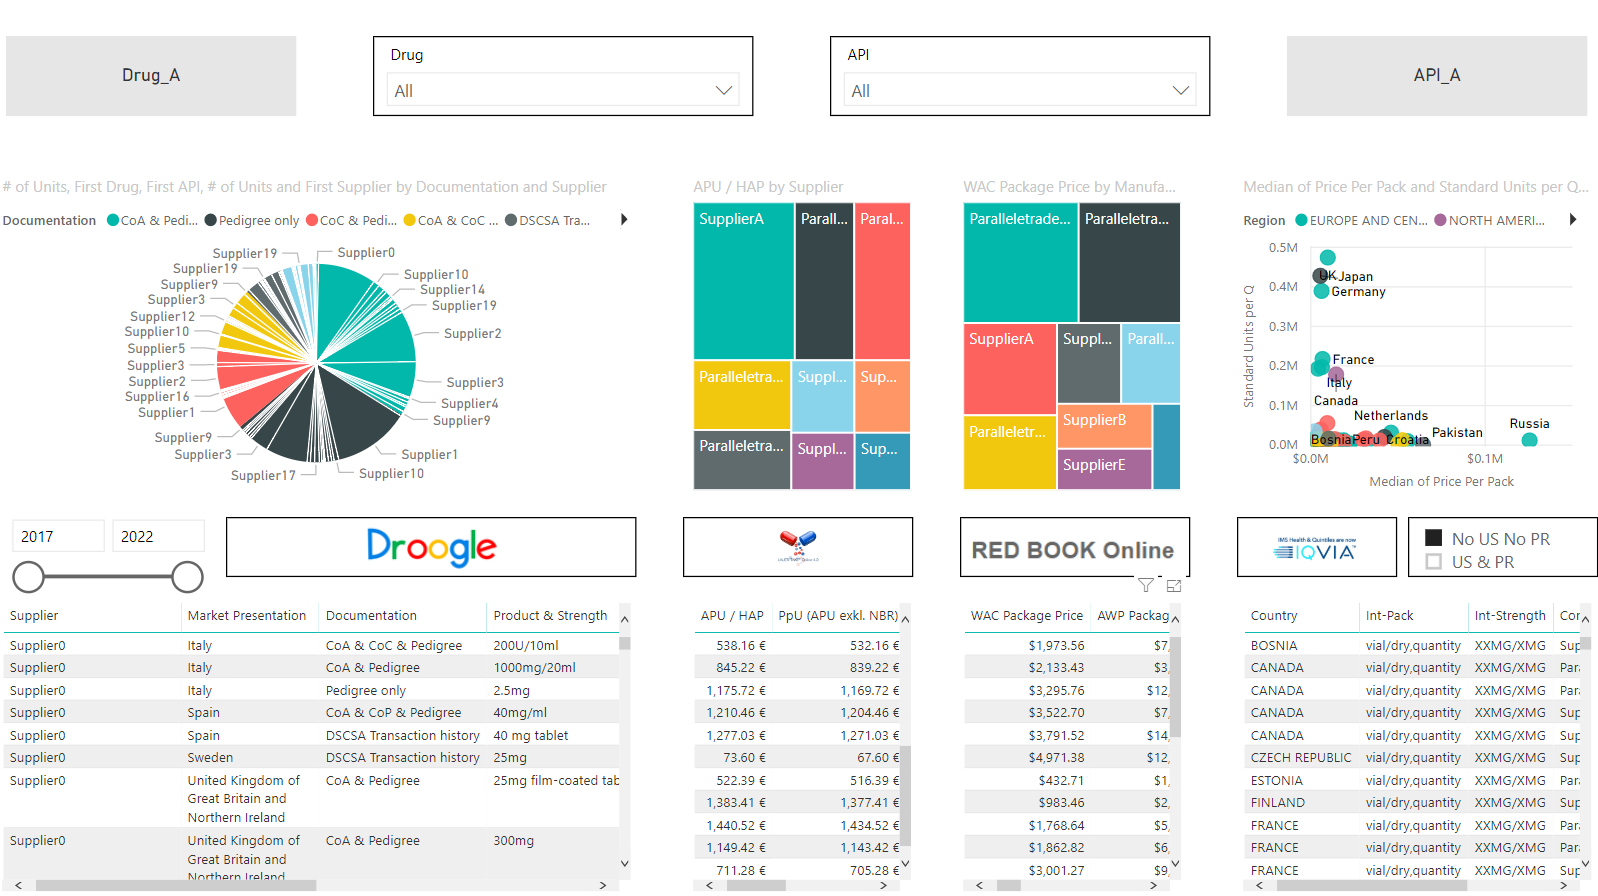
4c-Visual
The second core element of this Project is a Power Bi report. Power Bi is an interactive Business Intelligence Tool developed by Microsoft (Official Pages). It allows to easily visualize datasets and distribute interactive and visually appealing reports to stakeholders/consumers.
Before creating Power Bi Reports one should think about two main aspects:
- Distribution - How will the Data be shared ?
- Data synchronization - Is the data “static” or continously changing ?
If the data source is static or you are the only consumer you can skip this part
Distribution
According to the documentation of Power Bi it is advised to create a Report with Power Bi Desktop, publish it to a workspace and further share/distribute the Reports by publishing the app.
- Create a Power Bi Report with Power Bi Desktop
- Publish to a (new created) workspace
- Distribute via an app
If it is intended to share the data with a larger consumer/stakeholder group and not all of the users possess a Power Bi Pro license it is advised to create a Premium Workspace (has a diamond symbol next to it - which means it is hosted on a Premium Node). The Premium Workspace allows to share/distribute the reports/app also to consumers/stakeholders without Power Bi Pro license.
If all consumers/stakeholders are Power Bi Pro Users (possess a Power Bi license) one can easily share the Reports or the App of any workspace (no Premium necessary).
Hint:
Larger companies often have the Premium Server capabilities and it is “quite” easy to receive a
Power Bi Premium workspace.
Note for TF: I found the contact person via Yammer group about Power Bi, searching for
Premium. IT Service portal: Service Catalog – Aplication Requests – Application Access – “Power Bi Premium”
Data synchronization
If the data is dynamic it is advised to store the processed data on SharePoint or OneDrive. This will allow Power Bi to update and synchronize the distributed data. (Scheduled Refresh, Manual Refresh).
Conclusion
The combination of Python to pull, cross-reference and process the data together with Power Bi to visualize and distribute the data in a consumer-friendly way is a very powerful tool to enable data driven decision making. This documentation can be used as a guideline to develop a customized Business Intelligence Tool for your needs.
If you would like to create an executable and schedule the executable have a look at https://github.com/EtienneEs/Easy-scripts/tree/master/autocopy#Appmaker. Simply install pyinstaller into your current environment and follow the instructinos how to schedule the executable.
If you have any questions please feel free to contact me.